After seeing consecutive 10 weeks of successful forecasting using the 1SD Formula in Nifty weekly levels, are you excited to learn more? Here we reveal powerful option strategies using the 1SD Formula.
The paid tool for option strategy can be seen at using this link
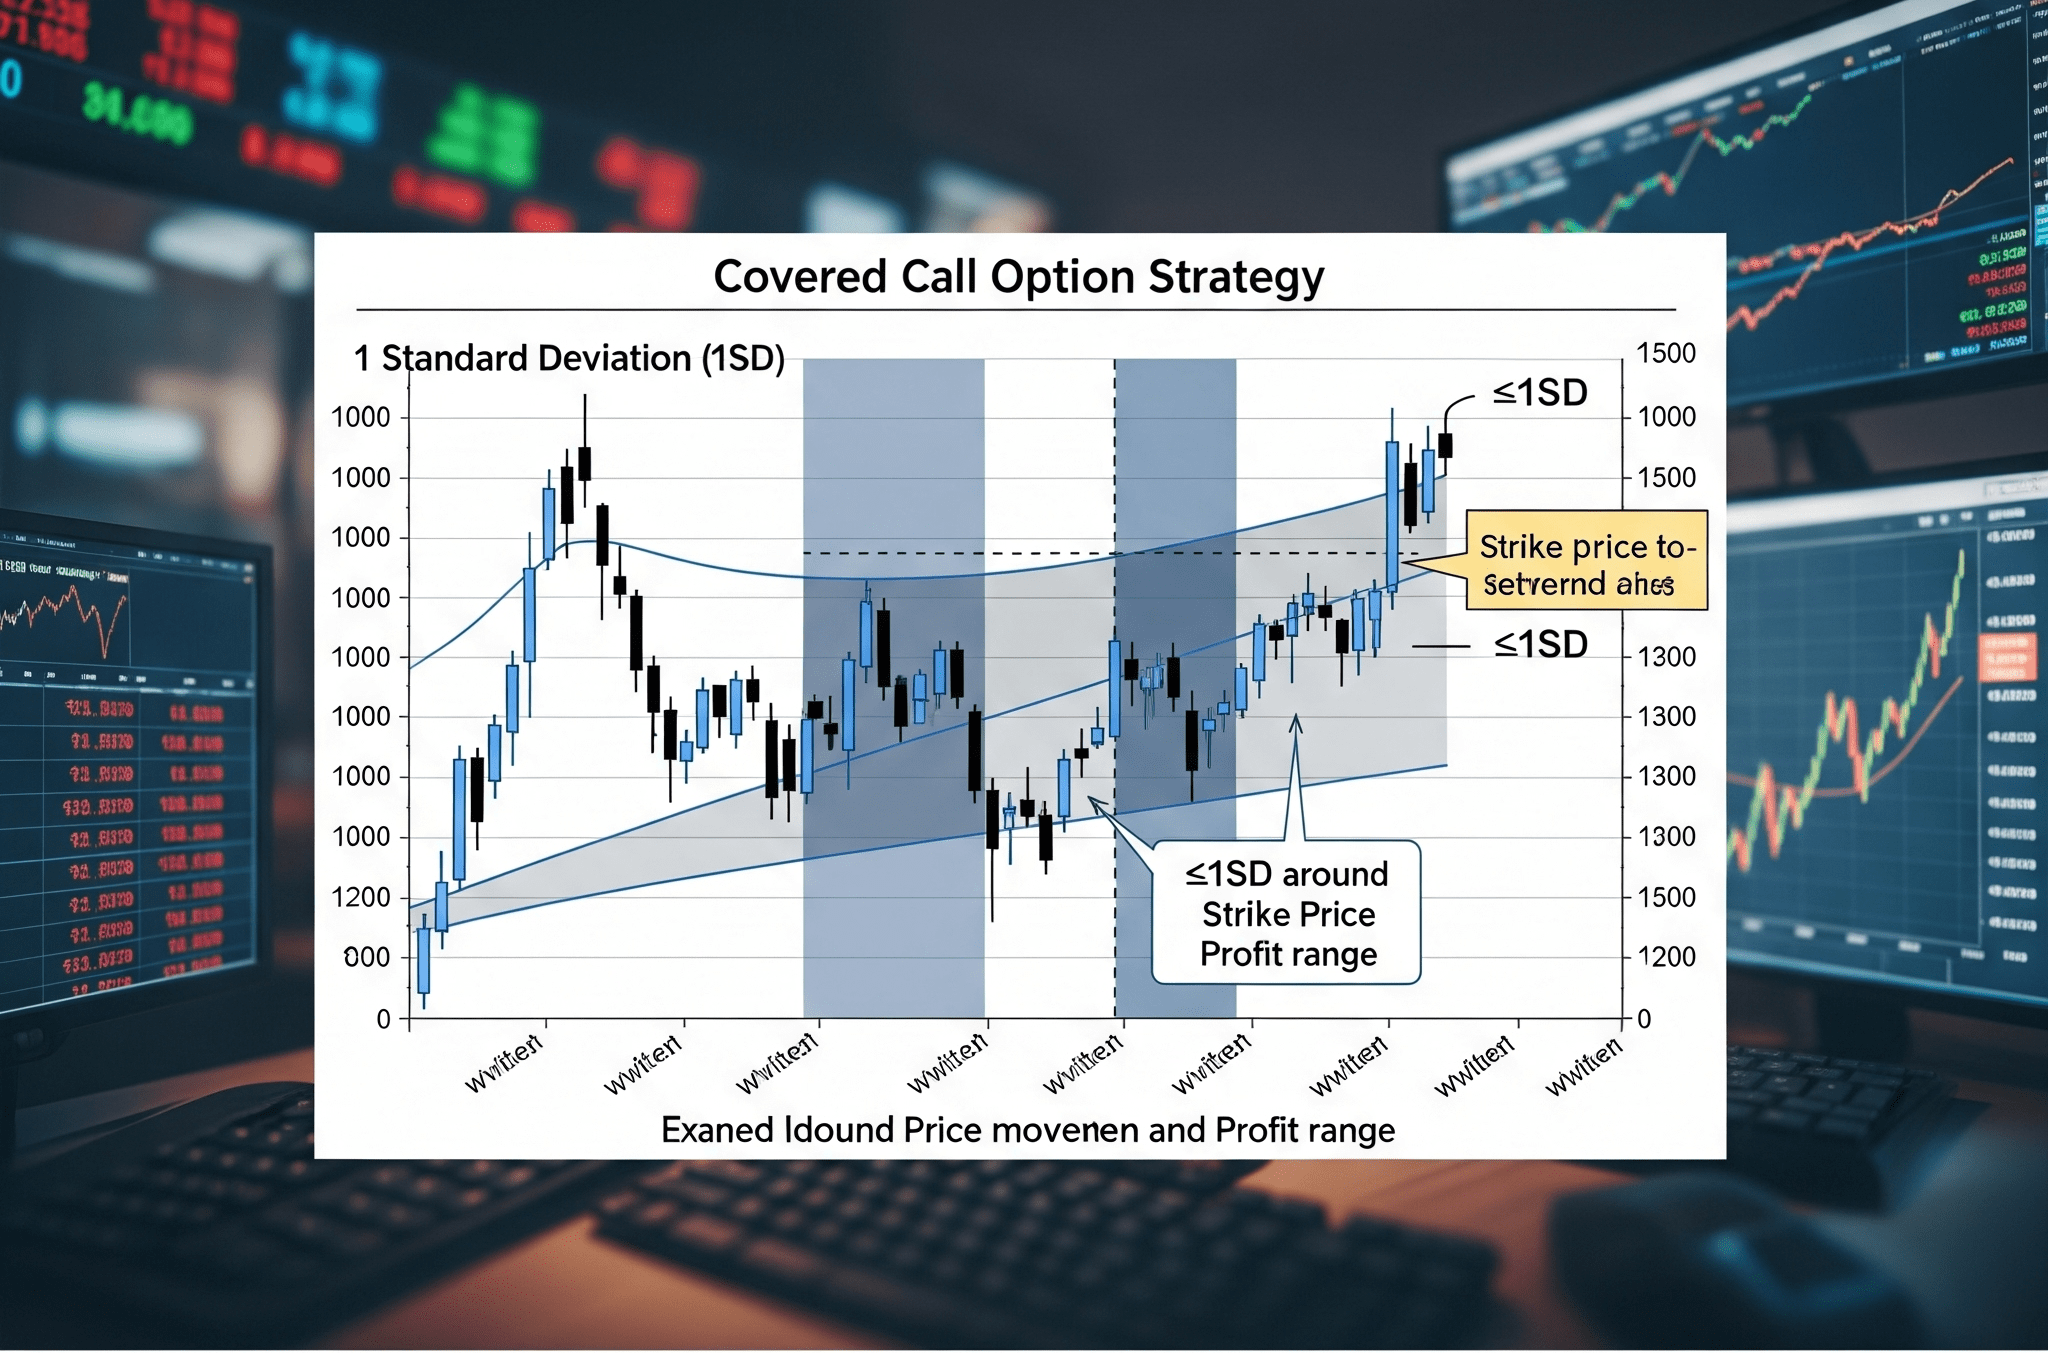
A covered call or covered put option strategy involves buying the future and selling a call option simultaneously. This approach combines directional exposure with premium collection.
Traders employ this strategy when expecting price movement within a narrow range with minimal downside risk. Similarly, covered puts are used when anticipating limited upside potential. These strategies convert range-bound expectations into profitable positions.
Covered strategies are partially close-end, offering limited profit potential but requiring careful risk management as losses can be substantial if not properly controlled.
Without technical understanding, these strategies often fail. They can produce significant losses if not converted to close-end strategies with defined risk parameters.
With slight modifications, these strategies can become consistently profitable:
Carefully study the November 2015 examples below to understand this strategy's performance with 1SD levels.
Example 1: November 1st Week 2015
Trend expectation: Uptrend confirmation at 8120, successful crossover above 8179 targets 8220-8274-8333. Downtrend confirmation at 8047, breakdown below 7989 targets 7947-7893-7834.
Actual performance: November 2nd downside breakout failed. November 3rd upside breakout achieved 0.5 retracement. November 5th downside breakout achieved 0.888 retracement.
Hypothetical trade: November 2nd initiated covered put - sell future at 8047, sell 8000 PE @132 (near 7989), buy 8200 CE @78 (near 8179). Exit if price moves above 8220 (loss) or below 7947 (profit).
November 6th results: Future profit 100 points, 8200 CE loss 35.5 points, 8000 PE loss 34 points. Net profit: ₹1,762.50
Example 2: November 2nd Week 2015
Trend expectation: Uptrend confirmation at 8029, breakout above 8102 targets 8133-8217-8289. Downtrend confirmation at 7940, breakdown below 7869 targets 7837-7752-7680.
Actual performance: November 9th downside breakout achieved 1.236 retracement by November 13th.
Hypothetical trade: November 9th sell future at 7940, sell 7900 PE @83 (near 7869), buy 8100 CE @33.80. Exit above 8133 (loss) or below 7752 (profit).
November 13th results: 7900 PE loss 104.5 points, future profit 197.5 points, 8100 CE loss 27.5 points. Net profit: ₹4,912.50
Example 3: November 3rd Week 2015
Trend expectation: Uptrend confirmation at 7803, breakout above 7855 targets 7893-7941-7994. Downtrend confirmation at 7737, breakdown below 7684 targets 7647-7598-7546.
Actual performance: Volatile week with multiple trend changes and retracements.
Hypothetical trade: November 16th sell future at 7738, sell 7700 PE @63, buy 7850 CE @38. Exit at 7880.65 (0.786 level).
Results: Future loss 142.65 points, 7850 CE profit 47.8 points, 7700 PE profit 44.75 points. Net loss: ₹3,757.60 (but potential ₹3,000 profit with proper adjustments)
Conclusion:
When combined with 1SD levels, this strategy can protect 95% of capital while generating consistent monthly returns of 3-4% after expenses.
For more strategies, refer to "Master Key to Futures and Options" which details 22 option strategies for Indian markets.